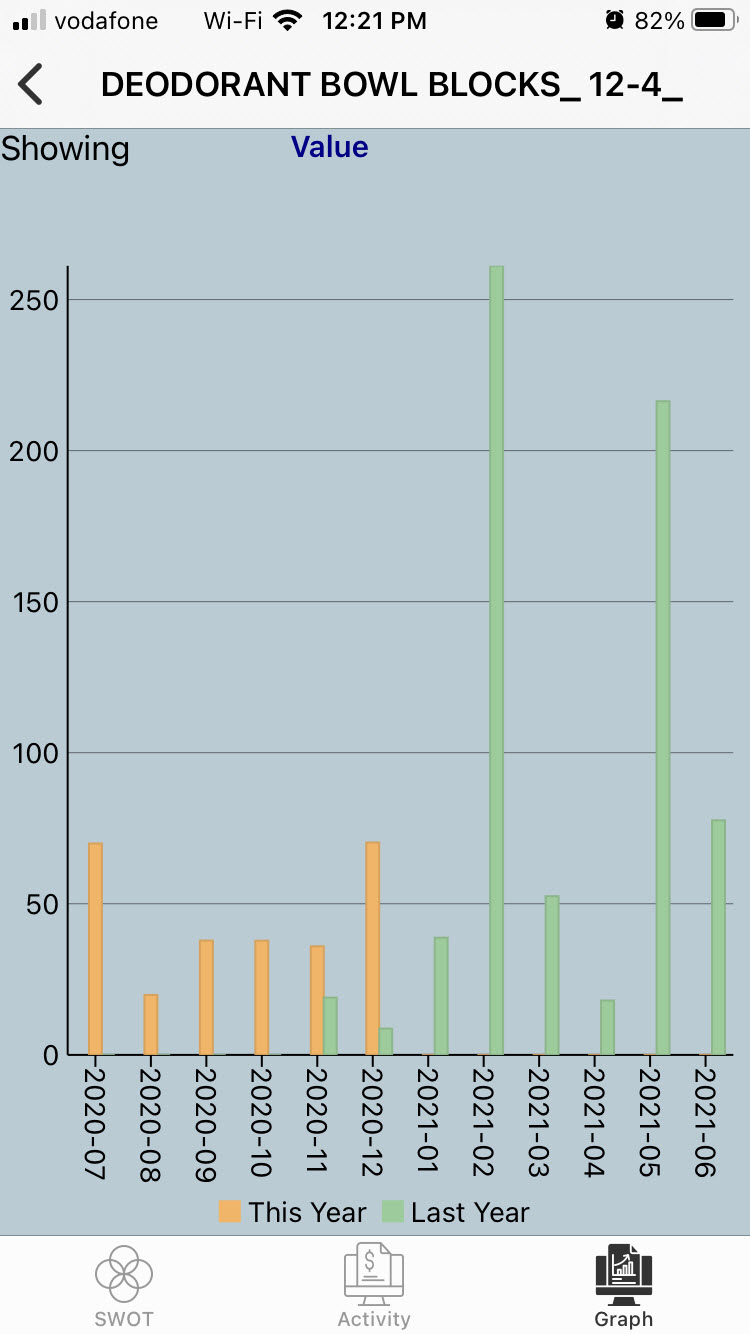
Product Graphs shows the past 24-hour activity for that particular product. When it is sold, perhaps showing graphically the seasonality of the product.
You can also show the value, the number of units or the margin that has been made. If you click on a particular bar, you will see the values show up on the graph.