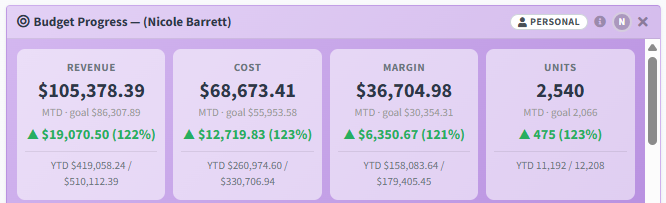


7. The dashboard widget
Add the Budget widget to your dashboard to keep month-to-date and year-to-date budget against actual in view without opening a report. It offers MTD value, MTD budget, MTD variance, the month's total goal, and the YTD equivalents, across five measures — Revenue, Cost, Margin, Units and Margin %. As on Budget Progress, the Margin % line is a rate: its month-to-date budget is the full month's rate, and its variance is in percentage points.
The widget can be scoped to you personally or to the whole company using the toggle in its header. Personal scope resolves your linked sales rep — and their territory group, if they are in one — from your login, so you see your own numbers without configuring anything.
It can be shown two ways. The default is a small grid of the figures above; the alternative is a row of KPI cards — Revenue, Cost, Margin, Units and Margin % — each giving month-to-date actual against the month's goal with a variance arrow. The cards carry the same numbers in a form that reads at a glance from across a desk; the grid is the one to keep if you want to compare the measures against each other.