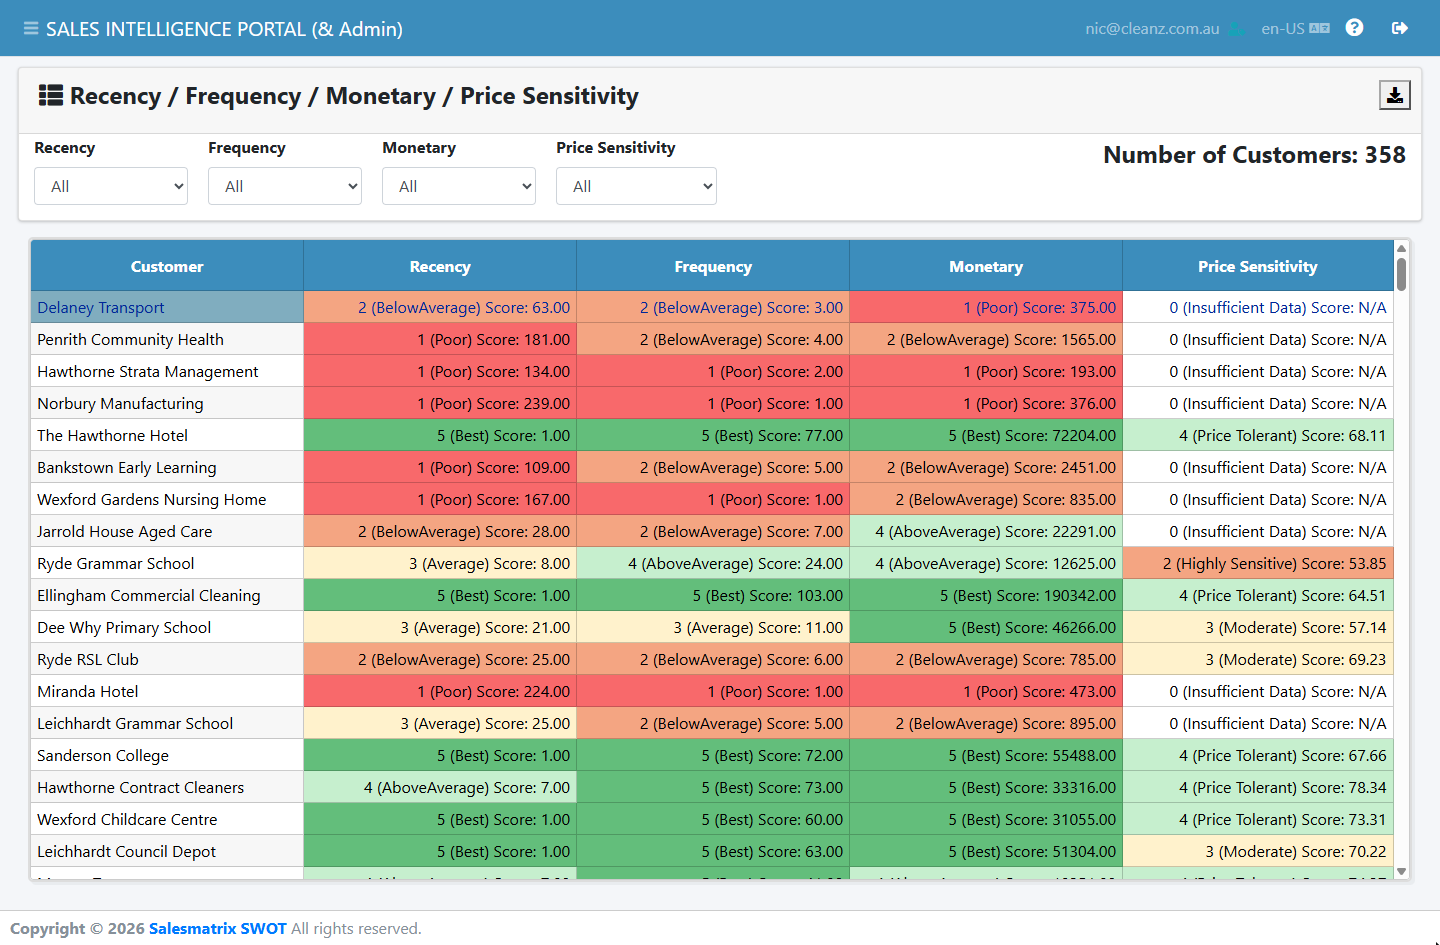


3.1 RFM Analysis — the four scores
RFM Analysis lists your customers with four scores, each from 1 to 5 and coloured from red (poor) to green (best):
| Score | Measures |
|---|---|
| R Recency | How recently the customer last bought. |
| F Frequency | How often they buy. |
| M Monetary | How much they spend. |
| P Price Sensitivity | How they react when a price changes. See 3.2. |
The bands are Best (5), Above Average (4), Average (3), Below Average (2) and Poor (1). Each cell shows the band and the underlying score.