


5. Adding a pre-defined widget
Open the catalogue
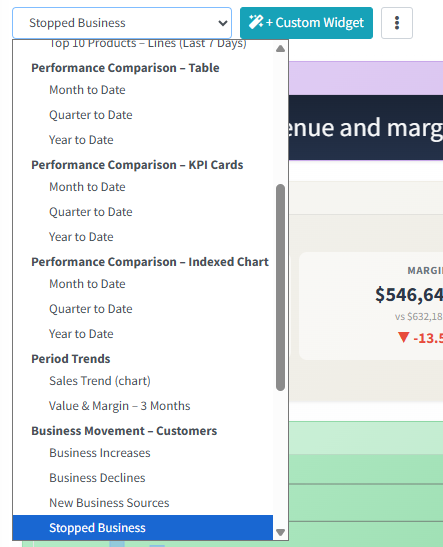
Click the — + Pre-defined Widget — drop-down at the top left of the dashboard.
Pick a widget
The list is grouped by purpose (see the table below). Click an entry and the widget is placed at the next free spot and starts loading.
Save
Open the actions menu (⋮) and choose Save Layout, or the new widget will not be there next time.
| Group | Widgets | Good for |
|---|---|---|
| My Budget Progress | Grid, or KPI Cards | Month- and year-to-date against budget for your own patch. Offered once your login is linked to a sales rep and your subscription includes Budget. |
| Top N – Customers / Products | Top 10 by Value (MTD), Margin (YTD), Lines, Units | Who and what is carrying the period. |
| Performance Comparison | Month / Quarter / Year to Date, as a table, KPI cards or an indexed chart | This period against the same period last year. |
| Period Trends | Sales Trend (chart); Value & Margin – 3 Months | The shape of the last year, or the last quarter month by month. |
| Business Movement – Customers | Business Increases, Business Declines, New Business Sources, Stopped Business, Lapsed Products by Customer | A call list: who is growing, fading, new, gone or overdue. |
| SWOT Lookup Widgets | Customer SWOT, Product SWOT | A one-customer or one-product SWOT summary before a call. |
| Dynamic Reports – pre-configured | Revenue by Month, Margin by Product, Units by Sales Rep | One-click launch into a ready-made Dynamic Report. |
| Quick Links & Alerts | Quick Links – Reports / Admin, My Favourites, Alert Ticker Stream | Shortcuts, your saved reports, and a scrolling feed of notable sales events. |