


Sales Mix Shift
The Question Matrix
The result is a grid of sixteen bands, from Top Revenue with High Margin down to Low Activity with Nil Margin. Each cell shows how many records sit in that band now, and how that count has changed since the earlier period. Beneath the grid, a Lost row counts records that were trading before and are not trading now.
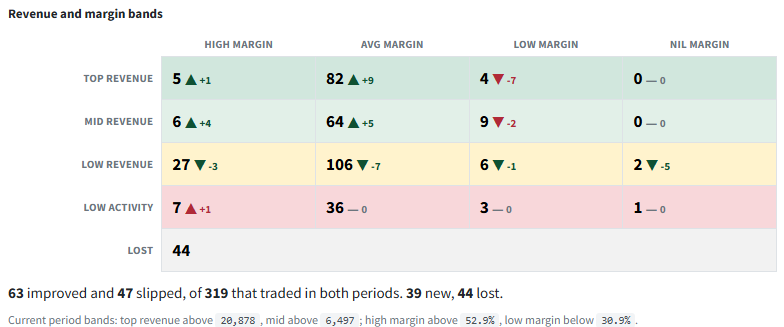
Each cell of the grid answers one question. Click the cell and the list is the answer. The line under each question says what to do with that list, and whether a rising count in that cell is good or bad news.
CustomersWhich of my biggest customers are also my most profitable?
ProductsWhich best sellers also earn the best margin?
Your core. Protect it: named contact, account plan, first call on stock.
▲ Rising count is good newsCustomersWhich big customers pay a normal price, with room to lift it?
ProductsWhich best sellers earn a normal margin, where a small price rise adds a lot?
Small changes here move the total: price reviews, better mix, fewer discounts.
▲ Rising count is good newsCustomersWhich big customers buy a lot, but at a thin margin?
ProductsWhich best sellers carry a lot of volume at a thin margin?
Check the price list, special deals and cost to serve. Is the volume worth what it costs?
▲ Rising count needs a lookCustomersWhich big customers are we supplying at cost or at a loss?
ProductsWhich best sellers are we selling at cost or at a loss?
Check the cost data first (an empty cost field lands here too), then the price.
▲ Rising count is bad newsCustomersWhich profitable mid-sized customers could become big ones?
ProductsWhich profitable products deserve more shelf space or promotion?
Your best growth targets: they already pay well. Give them to a rep with a target.
▲ Rising count is good newsCustomersWhich steady customers form the middle of my base?
ProductsWhich steady products hold up the range?
Look for what they don't buy yet. Market Basket shows what usually goes with what they do.
▲ Rising count is good newsCustomersWhich mid-sized customers get big-customer prices without big-customer volume?
ProductsWhich mid-selling products are priced too close to cost?
Bring their terms in line with what they buy.
▲ Rising count needs a lookCustomersWhich mid-sized customers earn us nothing?
ProductsWhich mid-selling products earn nothing?
Cost data first, then price. Often an old price nobody updated.
▲ Rising count is bad newsCustomersWhich small customers pay well, and could buy more?
ProductsWhich slow sellers earn a good margin, and could sell more?
Cheap growth: a call, an email or a cross-sell offer, not a visit.
▲ Rising count: check where they came fromCustomersWhich small customers are just ticking over?
ProductsWhich slow sellers are just ticking over?
Serve them cheaply: online ordering, phone sales, standard terms.
▲ Rising count is bad newsCustomersWhich small customers cost more to serve than they bring in?
ProductsWhich slow sellers at thin margins are candidates to drop?
Minimum order values, delivery charges, or a range review.
▲ Rising count is bad newsCustomersWhich small customers earn us nothing at all?
ProductsWhich slow sellers earn nothing at all?
Fix the price or stop the line. Check for samples and write-offs posted as sales.
▲ Rising count is bad newsCustomersWho bought once, at a good price? Is it a trial worth following up?
ProductsWhich products sold on one day only, at a good margin?
Follow up within weeks, not months. Look for New in the Move column.
▲ Rising count: check New against SlippedCustomersWho bought once: a one-off, or the start of something?
ProductsWhich products sold on one day only?
Split the list: New records are prospects, the rest have dropped to one order.
▲ Rising count: check New against SlippedCustomersWho bought once, on a deal? Did we buy that sale?
ProductsWhich products sold once, on a deal?
Judge the promotion that brought them in. Did anyone come back?
▲ Rising count is bad newsCustomersWho got something once, at no margin? Samples, replacements or errors?
ProductsWhich products went out once at no margin?
Usually a data question, not a sales one. Check how these were posted.
▲ Rising count is bad newsCustomersWho stopped buying, and who should I call first?
ProductsWhich products stopped selling? Discontinued, out of stock, or replaced?
Export it and sort by base revenue, then call from the top. The biggest losses are rarely the most obvious.
On the grid, the arrow's colour follows the meaning, not the direction. More records in the Top and Mid rows at a High or Avg margin show as good news. Everywhere else, including big accounts on a Low or Nil margin, a rising count shows as bad news.