


1. The page at a glance
Open Dynamic Reports from the side menu. It opens on Customer by Period, Revenue, Last 6 Months — a sensible first look — and every control across the top changes the report in place.
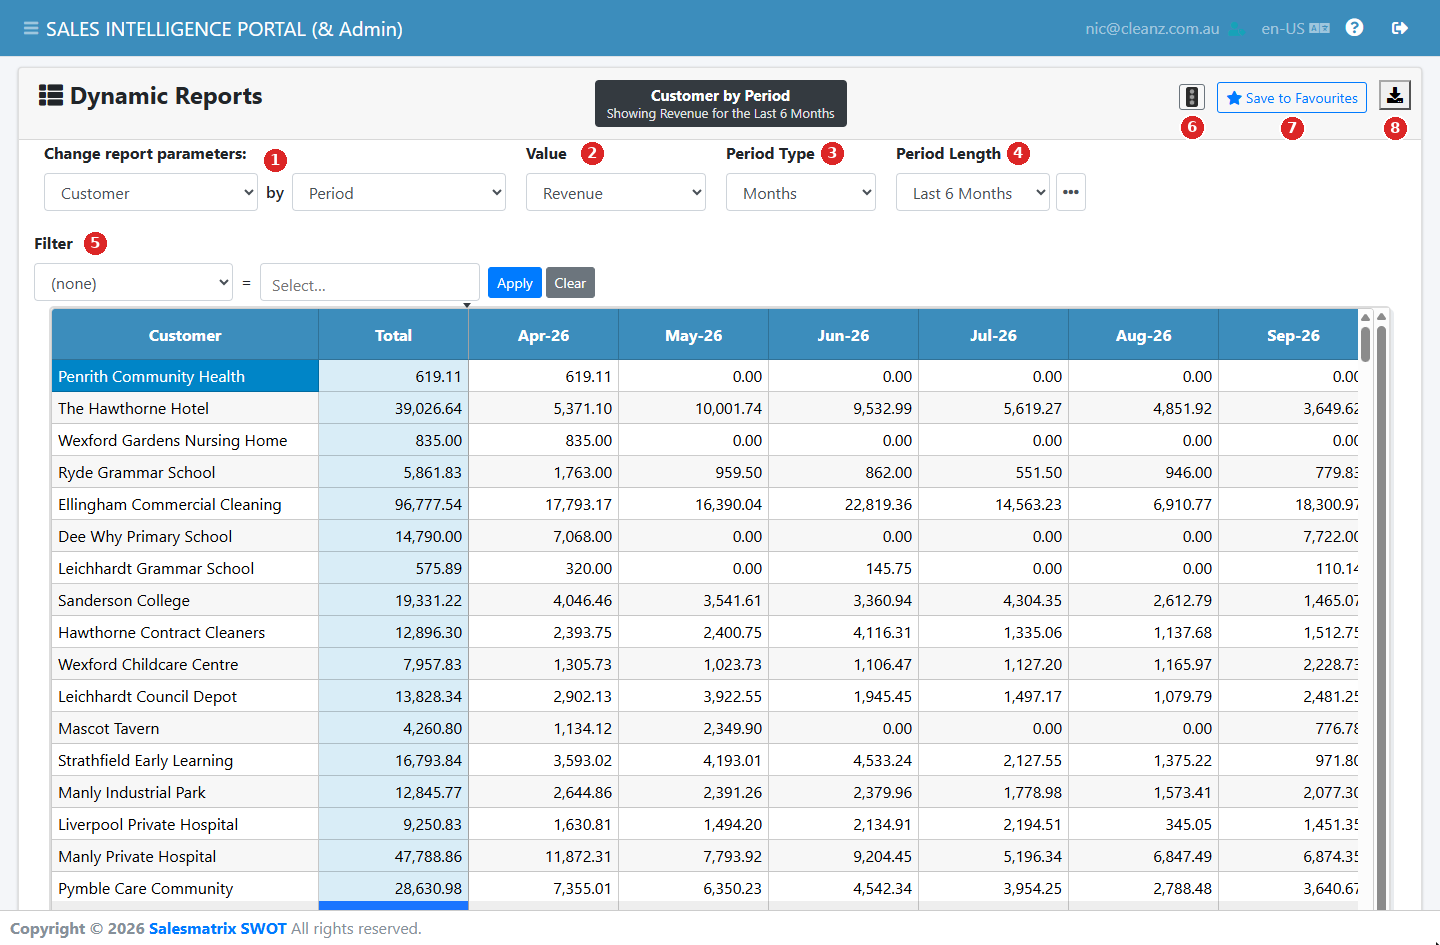
| Control | Decides |
|---|---|
| Change report parameters | What forms the rows and the columns. |
| Value | The figure in every cell. |
| Period Type | The size of each time bucket — days through to financial years. |
| Period Length | How far back the report reaches. The … button beside it holds further date settings. |
| Filter | Narrows the whole report to one sales rep, customer, product or category value. |
Read the title after every change. It is rewritten each time the grid loads, so it is the quickest check that the report is what you meant to ask for.